
搜索到
6
篇与
的结果
-
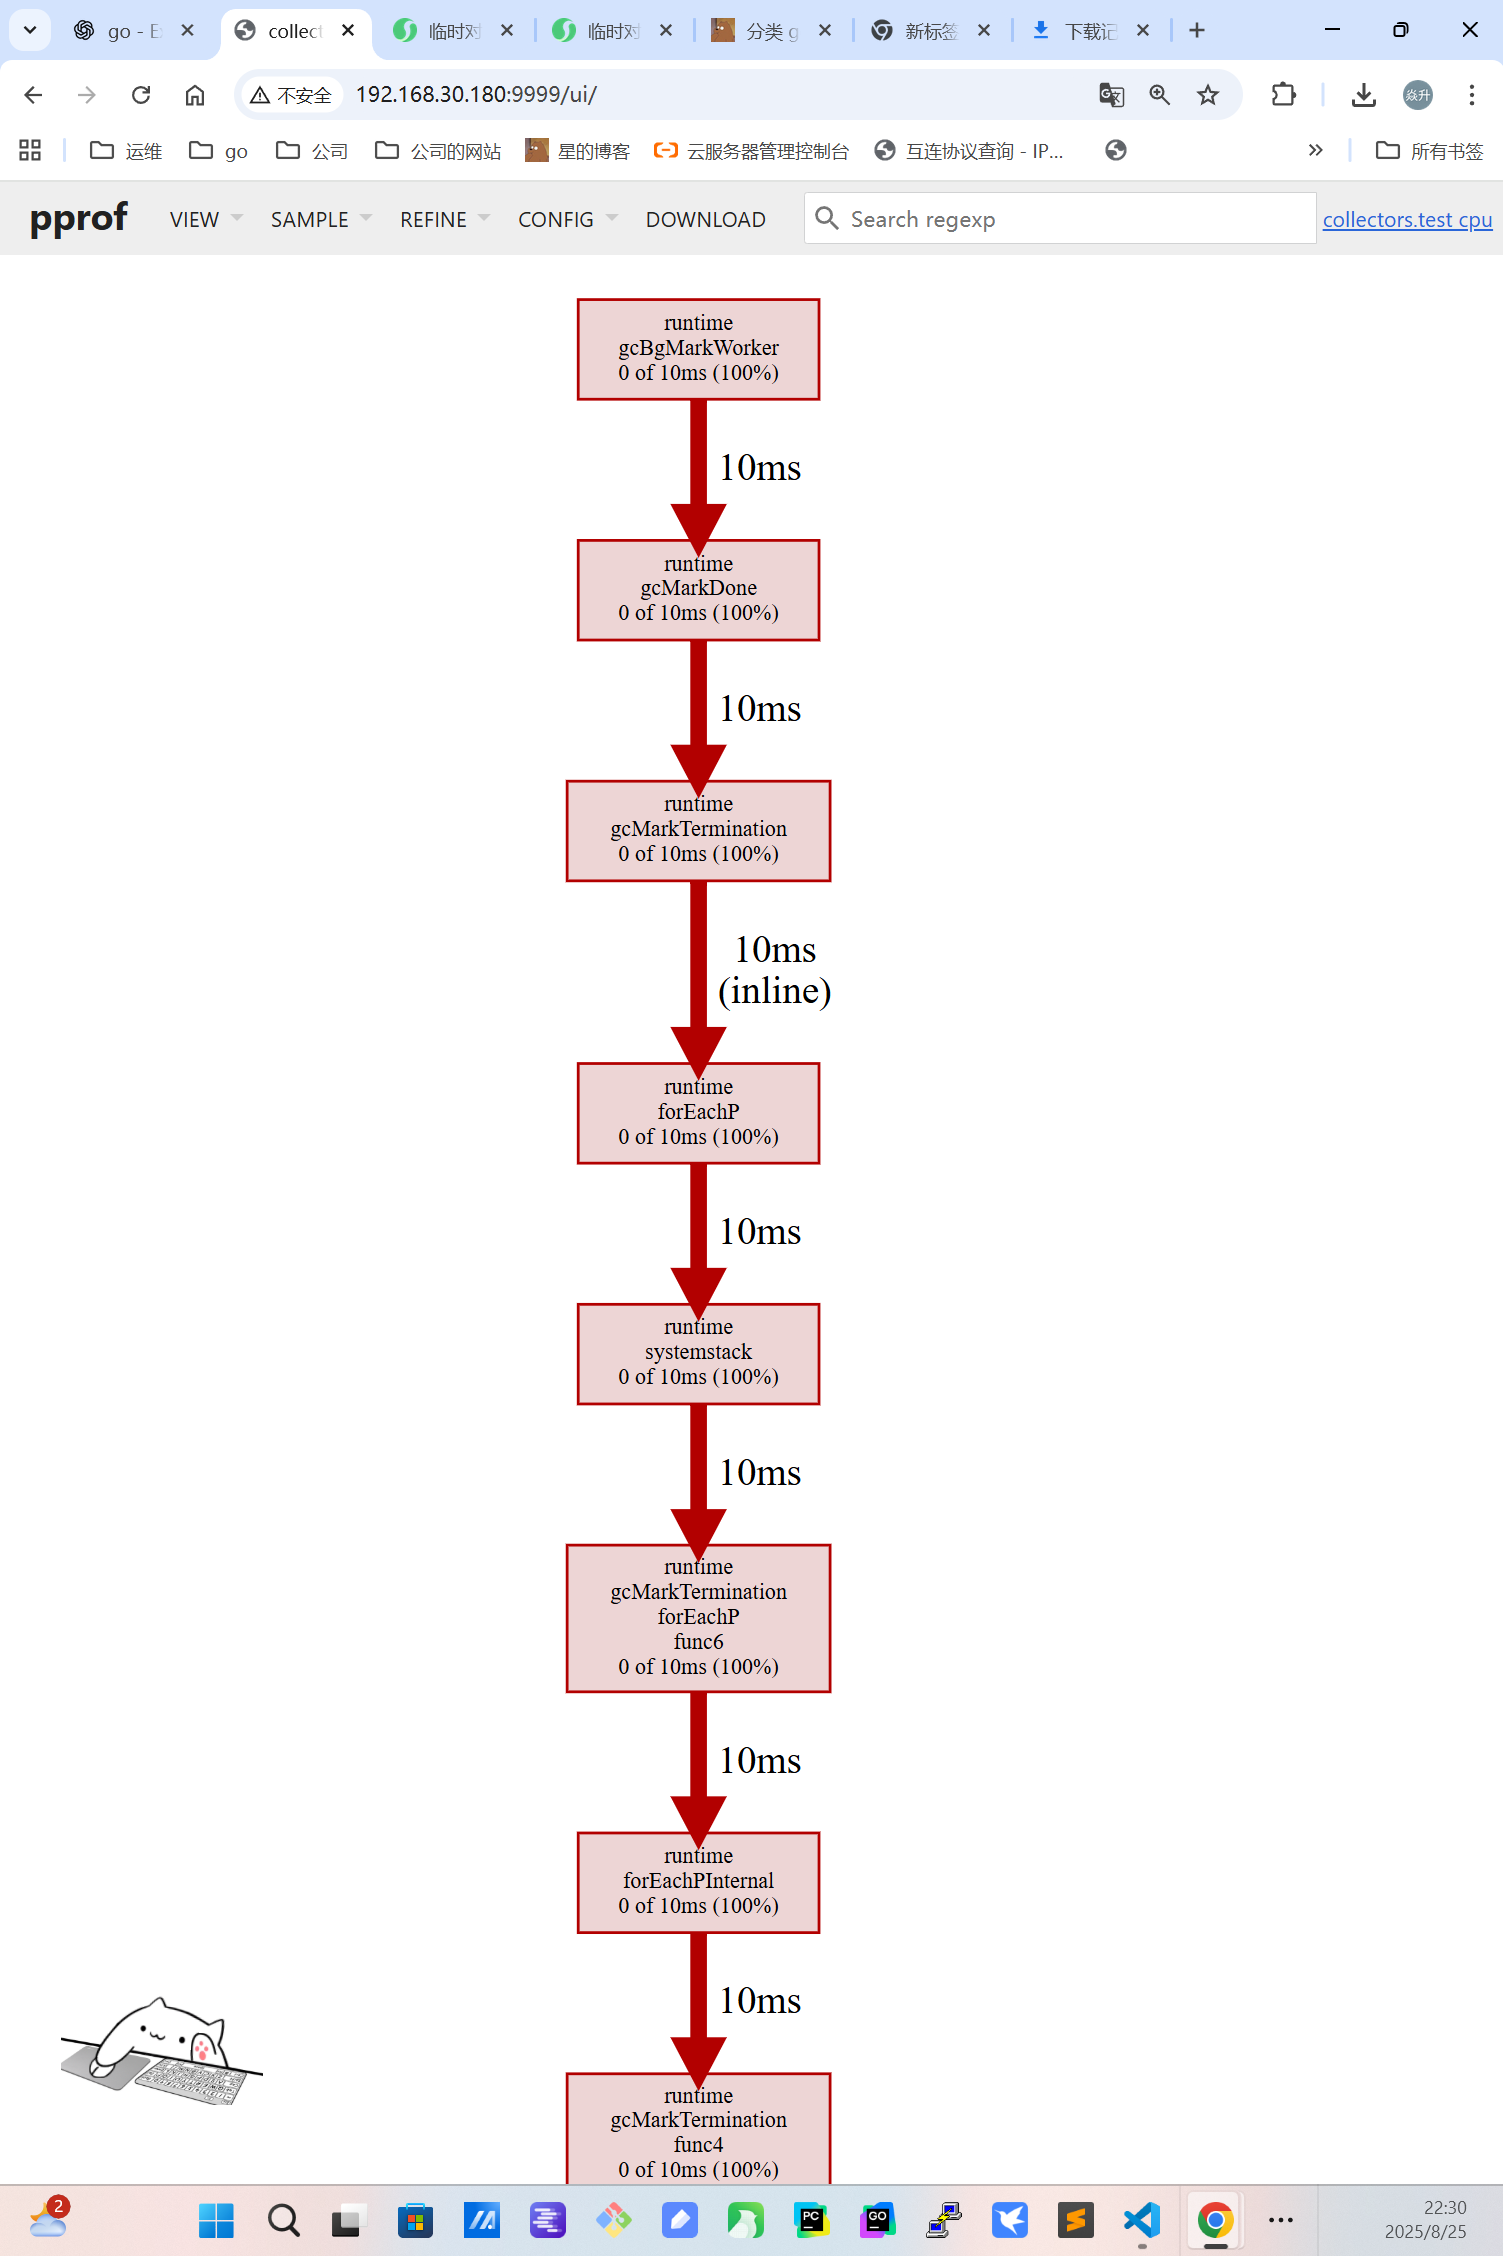
 Exporte + 基础指标 一、解压 & 目录说明unzip sys-exporter.zip -d sys-exporter cd sys-exporter tree -L 3 # . # ├── Makefile # ├── README.md # ├── cmd/sys-exporter/main.go # ├── go.mod # └── internal/collectors/ # ├── disk_usage.go # ├── disk_usage_test.go # ├── net_conn.go # ├── net_conn_test.go # ├── proc_rss.go # └── proc_rss_test.go 关键点: 使用自定义 Registry,同时注册 process 和 go collector。 /metrics 使用 promhttp.HandlerFor(reg, promhttp.HandlerOpts{EnableOpenMetrics:true})。 自带 /live、/ready,/ready 会尝试 Gather(),失败返回 503。 已挂好 /debug/pprof/*,方便做 CPU/内存采样。 三个示例指标: sys_mount_usage_ratio{mountpoint="/data"} (附带 sys_mount_used_bytes / sys_mount_total_bytes) sys_network_open_sockets{proto="tcp|udp", family="ipv4|ipv6"} sys_process_resident_memory_bytes(Exporter 进程自身 RSS)二、运行脚手架(本地 make run) 2.1 前置准备(只做一次)#下载go wget https://go.dev/dl/go1.22.5.linux-amd64.tar.gz #解压go sudo tar -C /usr/local -xzf go1.22.5.linux-amd64.tar.gz # 使用 vim: sudo vim ~/.bashrc #在文件的最后,添加以下几行: export PATH=$PATH:/usr/local/go/bin export GOPATH=$HOME/go export PATH=$PATH:$GOPATH/bin #立即生效 source ~/.bashrc #验证安装 go version #创建工作目录 mkdir -p ~/work && cd ~/work2.2一键跑起来(/metrics、/live、/ready)# 可选:拉依赖 make tidy # 启动 如果没有data目录 需要提前创建 make run # 日志应看到:sys-exporter listening on :9090 (mount=/data)#报错 root@k8s-01:~/woke/sys-exporter# make run GO111MODULE=on go run ./cmd/sys-exporter 2025/08/25 07:47:24 sys-exporter listening on :9090 (mount=/data) root@k8s-01:~/woke/sys-exporter# make test GO111MODULE=on go test ./... -race -count=1 # github.com/example/sys-exporter/internal/collectors [github.com/example/sys-exporter/internal/collectors.test] internal/collectors/disk_usage_test.go:22:37: undefined: testutil.NewGaugeFromDesc ? github.com/example/sys-exporter/cmd/sys-exporter [no test files] FAIL github.com/example/sys-exporter/internal/collectors [build failed] FAIL make: *** [Makefile:10: test] Error 1 root@k8s-01:~/woke/sys-exporter 这是单测里用了不存在的函数导致编译失败。prometheus/testutil 并没有 NewGaugeFromDesc 这个 API(我在示例里多写了一句检查 ratio 的代码)。解决方法:把那几行删掉,用 CollectAndCompare 做断言就够了。 #报错 root\@k8s-01:\~/woke/sys-exporter# make test GO111MODULE=on go test ./... -race -count=1 ? github.com/example/sys-exporter/cmd/sys-exporter \[no test files] \--- FAIL: TestProcRSSCollector (0.00s) proc\_rss\_test.go:31: metrics mismatch: +# HELP sys\_process\_resident\_memory\_bytes Resident memory (RSS) of the exporter process in bytes. +# TYPE sys\_process\_resident\_memory\_bytes gauge +sys\_process\_resident\_memory\_bytes 2.097152e+06 FAIL FAIL github.com/example/sys-exporter/internal/collectors 0.020s FAIL make: \*\*\* \[Makefile:10: test] Error 1 root\@k8s-01:~~/woke/sys-exporter# make tidy go mod tidy root\@k8s-01:~~/woke/sys-exporter# make test GO111MODULE=on go test ./... -race -count=1 ? github.com/example/sys-exporter/cmd/sys-exporter \[no test files] \--- FAIL: TestProcRSSCollector (0.00s) proc\_rss\_test.go:31: metrics mismatch: +# HELP sys\_process\_resident\_memory\_bytes Resident memory (RSS) of the exporter process in bytes. +# TYPE sys\_process\_resident\_memory\_bytes gauge +sys\_process\_resident\_memory\_bytes 2.097152e+06 FAIL FAIL github.com/example/sys-exporter/internal/collectors 0.018s FAIL make: \*\*\* \[Makefile:10: test] Error 1 root\@k8s-01:\~/woke/sys-exporter# cat internal/collectors/disk\_usage\_test.go package collectors import ( "strings" "testing" #解决办法 用下面的内容覆盖 internal/collectors/disk_usage_test.go: package collectors import ( "strings" "testing" "github.com/prometheus/client_golang/prometheus/testutil" ) func TestDiskUsageCollector_Metrics(t *testing.T) { mock := func(path string) (total, avail uint64, err error) { // 100 total, 25 available -> used=75, ratio=0.75 return 100, 25, nil } c := NewDiskUsageCollector("/data", mock) expected := # HELP sys_mount_total_bytes Total bytes for a mountpoint. # TYPE sys_mount_total_bytes gauge sys_mount_total_bytes{mountpoint="/data"} 100 # HELP sys_mount_used_bytes Used bytes for a mountpoint. # TYPE sys_mount_used_bytes gauge sys_mount_used_bytes{mountpoint="/data"} 75 # HELP sys_mount_usage_ratio Disk usage ratio (used/total) for a mountpoint. # TYPE sys_mount_usage_ratio gauge sys_mount_usage_ratio{mountpoint="/data"} 0.75 if err := testutil.CollectAndCompare(c, strings.NewReader(expected)); err != nil { t.Fatalf("unexpected metrics diff: %v", err) } } "github.com/prometheus/client_golang/prometheus/testutil" ) func TestDiskUsageCollector\_Metrics(t \*testing.T) { mock := func(path string) (total, avail uint64, err error) { // 100 total, 25 available -> used=75, ratio=0.75 return 100, 25, nil } c := NewDiskUsageCollector("/data", mock) expected := # HELP sys\_mount\_total\_bytes Total bytes for a mountpoint. # TYPE sys\_mount\_total\_bytes gauge sys\_mount\_total\_bytes{mountpoint="/data"} 100 # HELP sys\_mount\_used\_bytes Used bytes for a mountpoint. # TYPE sys\_mount\_used\_bytes gauge sys\_mount\_used\_bytes{mountpoint="/data"} 75 # HELP sys\_mount\_usage\_ratio Disk usage ratio (used/total) for a mountpoint. # TYPE sys\_mount\_usage\_ratio gauge sys\_mount\_usage\_ratio{mountpoint="/data"} 0.75 \ if err := testutil.CollectAndCompare(c, strings.NewReader(expected)); err != nil { t.Fatalf("unexpected metrics diff: %v", err) } } 你这个失败点在于单测期望的数值格式和PID 路径。 Prometheus 的文本输出里,浮点数经常是科学计数法(2.097152e+06),而你测试里写的是 2097152,导致对比失败。 你的测试里把 status 路径硬编码成 /fake/123/status,但实际 os.Getpid() 不一定是 123,最好用真实 PID 组路径。 把 internal/collectors/proc_rss_test.go 改成下面这样(两点都修了): package collectors import ( "os" "path/filepath" "strings" "testing" "github.com/prometheus/client_golang/prometheus/testutil" ) func TestProcRSSCollector(t *testing.T) { root := "/fake" // 使用真实 PID 组路径,避免硬编码 123 statusPath := filepath.Join(root, strconv.Itoa(os.Getpid()), "status") data := "Name:\tapp\nVmRSS:\t2048 kB\n" // 2048 KB => 2,097,152 bytes // 只要命中 <root>/<pid>/status 就返回我们伪造的数据 reader := func(path string) ([]byte, error) { if path == statusPath { return []byte(data), nil } // 返回空数据,不要报错,Collector 会自己忽略 return []byte(""), nil } c := NewProcRSSCollector(root, reader) // 注意:Prometheus 文本输出常是科学计数法,这里用 e+06 exp := # HELP sys_process_resident_memory_bytes Resident memory (RSS) of the exporter process in bytes. # TYPE sys_process_resident_memory_bytes gauge sys_process_resident_memory_bytes 2.097152e+06 if err := testutil.CollectAndCompare(c, strings.NewReader(exp)); err != nil { t.Fatalf("metrics mismatch: %v", err) } }#报错 root\@k8s-01:~~/woke/sys-exporter# vi internal/collectors/disk\_usage\_test.go root\@k8s-01:~~/woke/sys-exporter# ls cmd go.mod go.sum internal Makefile README.md root\@k8s-01:~~/woke/sys-exporter# go clean -testcache root\@k8s-01:~~/woke/sys-exporter# make test GO111MODULE=on go test ./... -race -count=1 # github.com/example/sys-exporter/internal/collectors \[github.com/example/sys-exporter/internal/collectors.test] internal/collectors/proc\_rss\_test.go:12:6: TestProcRSSCollector redeclared in this block internal/collectors/disk\_usage\_test.go:12:6: other declaration of TestProcRSSCollector internal/collectors/disk\_usage\_test.go:15:36: undefined: strconv ? github.com/example/sys-exporter/cmd/sys-exporter \[no test files] FAIL github.com/example/sys-exporter/internal/collectors \[build failed] FAIL make: \*\*\* \[Makefile:10: test] Error 1 root\@k8s-01:\~/woke/sys-exporter# cat internal/collectors/disk\_usage\_test.go package collectors import ( "os" "path/filepath" "strings" "testing" "github.com/prometheus/client_golang/prometheus/testutil" ) func TestProcRSSCollector(t \*testing.T) { root := "/fake" // 使用真实 PID 组路径,避免硬编码 123 statusPath := filepath.Join(root, strconv.Itoa(os.Getpid()), "status") data := "Name:\tapp\nVmRSS:\t2048 kB\n" // 2048 KB => 2,097,152 bytes // 只要命中 <root>/<pid>/status 就返回我们伪造的数据 reader := func(path string) ([]byte, error) { if path == statusPath { return []byte(data), nil } // 返回空数据,不要报错,Collector 会自己忽略 return []byte(""), nil } c := NewProcRSSCollector(root, reader) // 注意:Prometheus 文本输出常是科学计数法,这里用 e+06 exp := ` # HELP sys\_process\_resident\_memory\_bytes Resident memory (RSS) of the exporter process in bytes. # TYPE sys\_process\_resident\_memory\_bytes gauge sys\_process\_resident\_memory\_bytes 2.097152e+06 \` if err := testutil.CollectAndCompare(c, strings.NewReader(exp)); err != nil { t.Fatalf("metrics mismatch: %v", err) } } 你把 disk_usage_test.go 覆盖成了 proc_rss_test.go 的内容,所以现在: 出现了重复的 TestProcRSSCollector(两个文件里同名测试)。 且缺少 strconv 的 import 还原 disk_usage_test.go 把它恢复成“磁盘使用率”的测试(不要放 RSS 的测试): // internal/collectors/disk_usage_test.go package collectors import ( "strings" "testing" "github.com/prometheus/client_golang/prometheus/testutil" ) func TestDiskUsageCollector_Metrics(t *testing.T) { mock := func(path string) (total, avail uint64, err error) { // 100 total, 25 available -> used=75, ratio=0.75 return 100, 25, nil } c := NewDiskUsageCollector("/data", mock) expected := ` # HELP sys_mount_total_bytes Total bytes for a mountpoint. # TYPE sys_mount_total_bytes gauge sys_mount_total_bytes{mountpoint="/data"} 100 # HELP sys_mount_used_bytes Used bytes for a mountpoint. # TYPE sys_mount_used_bytes gauge sys_mount_used_bytes{mountpoint="/data"} 75 # HELP sys_mount_usage_ratio Disk usage ratio (used/total) for a mountpoint. # TYPE sys_mount_usage_ratio gauge sys_mount_usage_ratio{mountpoint="/data"} 0.75 ` if err := testutil.CollectAndCompare(c, strings.NewReader(expected)); err != nil { t.Fatalf("unexpected metrics diff: %v", err) } } 修正 proc_rss_test.go 确保它只包含 RSS 的测试,且 加上 strconv 的 import: // internal/collectors/proc_rss_test.go package collectors import ( "os" "path/filepath" "strconv" "strings" "testing" "github.com/prometheus/client_golang/prometheus/testutil" ) func TestProcRSSCollector(t *testing.T) { root := "/fake" statusPath := filepath.Join(root, strconv.Itoa(os.Getpid()), "status") data := "Name:\tapp\nVmRSS:\t2048 kB\n" // 2048 KB => 2,097,152 bytes reader := func(path string) ([]byte, error) { if path == statusPath { return []byte(data), nil } return []byte(""), nil } c := NewProcRSSCollector(root, reader) exp := ` # HELP sys_process_resident_memory_bytes Resident memory (RSS) of the exporter process in bytes. # TYPE sys_process_resident_memory_bytes gauge sys_process_resident_memory_bytes 2.097152e+06 ` if err := testutil.CollectAndCompare(c, strings.NewReader(exp)); err != nil { t.Fatalf("metrics mismatch: %v", err) } } #正常 root@k8s-01:~/woke/sys-exporter# go clean -testcache make test GO111MODULE=on go test ./... -race -count=1 ? github.com/example/sys-exporter/cmd/sys-exporter [no test files] ok github.com/example/sys-exporter/internal/collectors 1.019s#报错 root@k8s-01:~/woke/sys-exporter# make bench GO111MODULE=on go test ./... -run=^$ -bench=. -benchmem -count=1 -cpuprofile cpu.out -memprofile mem.out cannot use -cpuprofile flag with multiple packages make: *** [Makefile:13: bench] Error 1 #cannot use -cpuprofile flag with multiple packages 意思是:你下了 -cpuprofile 参数,但 go test ./... 会一次性跑多个包(cmd/... 和 internal/...),Go 不允许把多个包的基准同时写到一个 cpu.out 里。 解决方法 只 bench 你有基准的那个包(internal/collectors),而不是所有 ./...。 bench: GO111MODULE=on go test ./internal/collectors -run=^$$ -bench=. -benchmem -count=1 -cpuprofile cpu.out -memprofile mem.out @echo "" @echo "CPU profile: cpu.out | Mem profile: mem.out" @echo "Open an interactive view:" @echo " go tool pprof -http=:9999 cpu.out" 执行make bench 能正常生成 cpu.out 和 mem.out#报错 root\@k8s-01:\~/woke/sys-exporter# make bench GO111MODULE=on go test ./internal/collectors -run=^\$ -bench=. -benchmem -count=1 -cpuprofile cpu.out -memprofile mem.out PASS ok github.com/example/sys-exporter/internal/collectors 0.252s CPU profile: cpu.out | Mem profile: mem.out Open an interactive view: go tool pprof -http=:9999 cpu.out root\@k8s-01:~~/woke/sys-exporter# ls cmd collectors.test cpu.out go.mod go.sum internal Makefile mem.out README.md root\@k8s-01:~~/woke/sys-exporter# go tool pprof -http=:9999 cpu.out Serving web UI on [http://localhost:9999](http://localhost:9999) Couldn't find a suitable web browser! Set the BROWSER environment variable to your desired browser. 浏览器[http://192.168.30.180:9999/](http://192.168.30.180:9999/) 打不开 这是正常现象:现在的 pprof Web UI 只监听在本机回环地址(localhost),所以你从别的机器用 http://192.168.30.180:9999 打不开 #解决 go tool pprof -http=0.0.0.0:9999 cpu.out 如果浏览器打开以后显示:Could not execute dot; may need to install graphviz. 那就需要安装 Graphviz sudo apt-get install -y graphviz sudo yum install -y graphviz 重新打开 pprof Web go tool pprof -http=0.0.0.0:9999 cpu.out 这时点击 “View → Graph” 或 “Flame Graph” 就能显示图像了。 root@k8s-01:~/woke/sys-exporter# go tool pprof -http=0.0.0.0:9999 cpu.out Serving web UI on http://0.0.0.0:9999 Couldn't find a suitable web browser! Set the BROWSER environment variable to your desired browser. cd ~/woke/sys-exporter LISTEN_ADDR=":9090" MOUNTPOINT="/data" make run # 看到日志:sys-exporter listening on :9090 (mount=/data)# 抓在线 profile 并用 Web UI 展示 用正确的 URL抓在线 profile 在 exporter 正常监听后再执行(仍然在服务器上): go tool pprof -http=0.0.0.0:9999 http://localhost:9090/debug/pprof/profile?seconds=15 注意要点: -http=0.0.0.0:9999 只是 Web UI 的监听地址; profile 的 URL 要作为最后一个参数单独给出(别写到 -http= 里); 如果你把 exporter 绑在了别的端口,比如 :9100,就把 URL 换成: http://localhost:9100/debug/pprof/profile?seconds=15